
The problems with the payback period method as a mean of analyzing and comparing potential investments extend beyond its problem with the time value of money. In fact, that problem can be corrected (but rarely is in practice) by using a method called the “Discounted Payback Period”, where the future expected cash flows are “discounted” to align them with the present value of the initial investment. But even with that correction, the Payback Period Method is still lacking as a primary return on investment (ROI) analysis tool.
If you missed part 1, check out “The Problems with Payback Period, Part 1“.
At the end of a ROI analysis using the payback period method, the project manager comes up with a time frame – such as 2.7 years – in which the initial investment will be paid back to the organization in the form of cost savings or increased net earnings. But the second major problem with this method is the question of what happens after the payback period (e.g. in years 3, 4 and 5).
Imagine two different cost saving projects that require identical initial investments and have identical payback periods. Are they equally valuable to the organization? How do you quantitatively decide between the two? Unfortunately, the payback period method is silent on these questions.
Two important inputs to a complete ROI analysis are the expected net earnings after the payback period, and the salvage value/costs of the equipment at the end of the project. Let consider a simple example to illustrate the effect of these critical inputs:
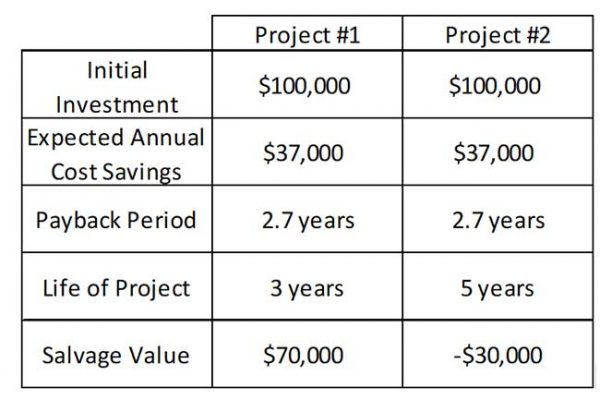
Our two projects may be different automated inspection systems competing for the same budget dollars. Both require the same initial investment and the same estimated annual cost savings. As a result, they have same payback period.
The differences occur after the payback period. Project #1 has an expected life of 3 years, while project #2 has an expected life of 5 years. Therefore, Project #2 will continue to add value to the organization in years 4 and 5 while the value contribution of Project #1 ends shortly after the payback period. In this light, Project # 2 is the better of the two.
A second factor that influences the value contribution of a project to an organization after the payback period is its salvage value. This is the estimated value of an asset at the end of its useful life, in our examples, either 3 or 5 years.
When you’re consider a major investment like a new factory or major capital equipment, it feels a bit strange to then also consider how you’re going to get rid of this thing after the project ends. But the value of that asset at the end of the project is often a key input to a thorough ROI analysis.
In our example, the salvage value of project #1 is $70,000, only 30% less than its original purchase price. This is a significant input in our analysis. Project # 1 may involve the purchase of flexible automation, which may still have a very high value to the organization after 3 years. Equipment like this can often be re-purposed within the organization and substantially offset the initial investment for the next capital purchase.
In project #2, the salvage value is -$30,000. Some dedicated equipment for instance tends to have little value after its project ends. With no market value as a piece of equipment, its sole value may come from selling it for scrap. But the salvage value of an asset also includes its de-installation cost. Some machines are heavy and require cranes and riggers to remove it. Some machines also require specialized foundations that need filled in they’re removed. De-installation costs like these needs factored in and can lead to a negative salvage value.
So in comparing our examples, the salvage value is a big plus for Project #1, but a significant negative for Project #2.
How then should you compare projects competing for the same budget dollars? The answer is simple: By calculating their financial contribution to the organization, over the entire life of the project, in “present day” dollars. In the next article, we’ll examine a method for doing this called the “Net Present Value”.
For a deeper dive into capital equipment justification, and to learn the essentials of business finance all managers need, sign up today for Return on Investment (ROI) Modeling and Analysis or Business Finance: A Complete Introduction.