
In the previous three articles, we’ve examined the Break-even Analysis and Pay-back Period methods as means of evaluating capital investments. While these back-of-the-napkin methods are excellent starting points for analyzing investments, they’re both poor ending points. Neither provide a good basis for comparing investments to each other. And neither tell you how much value an investment is adding to your organization.
Other methods such as the Internal Rate of Return and the Profitability Index also fall short of providing key insights to the value of an investment. Finance experts agree that the Net Present Value method is best for methods for delivery this type of analysis.
To see how it works, let’s consider a simple case study where an organization has an opportunity to purchase an automated assembly press for $50,000. The expected life of the assembly project is 7 years, at which time, the press will be sold in the used equipment market for $5,000. This automated press will speed up the assembly process resulting in a $10,000 per year cost savings. How much value would this project add to the organization?
To solve ROI problems, a graphical depiction of the case study like the one shown below is helpful for mapping out the various cash flows.
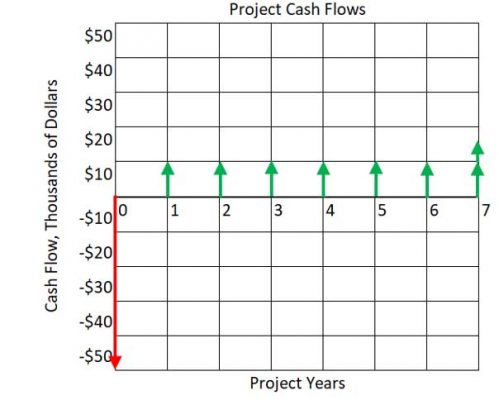
The initial investment is plotted as a -$50,000 at Year 0, the start of the project. Each of the annual $10,000 labor savings are plotted as +$10,000 at the end of each year, as is the one-time +$5,000 at the end of Year 7.
Using the Payback Period Method, we can easily calculate that the payback period of 5 years. But as we discussed in past article, this method does not account for the time value of money or any events after the payback period. These limitations seriously hamper its value as an analysis tool.
One key component of the Net Present Value Method is the model’s Discount Rate. This rate helps determine the present value of future cash flows. The initial investment of $50,000 is a present cash flow, but the annual costs savings and salvage value are future cash flows. We can’t mix these flows together because future dollars are worth less than present dollars. Like language translators convert Spanish to Russian (or any other language), the discount rate converts future cash flows at their varying distances into the future into a single present cash flow. Once everything is converted into present values, we can add and subtract the values with ease.
The discount rate is very similar to an interest rate with one exception. Interest rates project the future value of a present sum, whereas discount rates project the present value of future sums.
Consider an investment that pays 5% annual interest. If you invest $1,000 today, you will have $1,050 in 12 months. If you continue to invest for another 12 months, the 5% interest applies to the $1,050 compounding your investment to $1102.59 by the end of 24 months. This is expressed formulaically as follows:
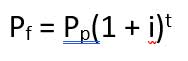
where Pf is the future value, Pp is the present value, i is the interest rate, and t is the number of time periods.
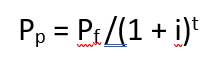
The formula for “discounting” future values to a present value based on a compounding discount rate is simply found my manipulating the above formula as follows:
Unlike interest, which is usually known at the start of an investment or loan, the discount rate is estimated by considering the organization’s Cost of Capital and the perceived risk of a project. In most organizations, a project’s discount rate (also called a “hurdle rate”) is set by the CFO.
Using our previous example, let’s assume a hurdle rate 9%. By discounting the future cash flows to their present-day value, then summing the results, we find that our project adds $3,065 of value to our organization.
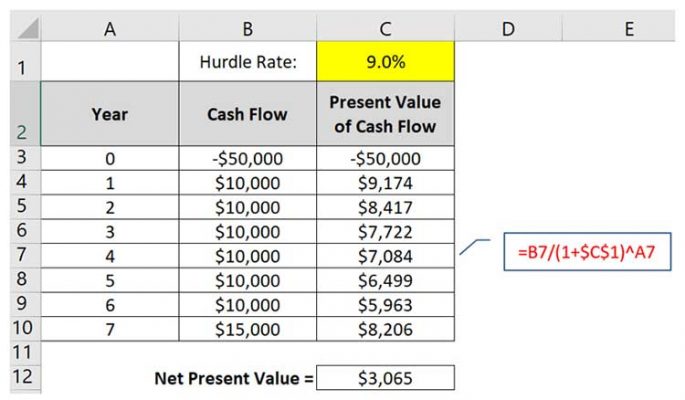
This is far less than the $25,000 we would obtain by simply summing our cash flows without regard to the cost of our organization’s capital.
The Net Present Value Method of calculating a project’s return on investment not only considers the entire project life cycle, but also the time value of money. As a result, NPV is suitable for comparing projects with different timelines and cash flows. It’s also effective in performing “Sensitivity Analysis”- the process of running different scenarios (e.g. best, worst and expected cases) and comparing their projected effect on the organization.
For a deeper dive into capital equipment justification and all the essentials of business finance, sign up today for Return on Investment (ROI) Modeling and Analysis or Business Finance: A Complete Introduction.