
One of the topics I teach in my online short course titled “Process Capability Analysis” is how to convert a capability index like Cpk to an estimation of the percentage of defects that process will produce. For more details on that process, see my Accendo blog titled “Converting A Capability Index to PPM Defective”.
The easiest and most common way to make that conversion is by using a table of capability indexes like this one:
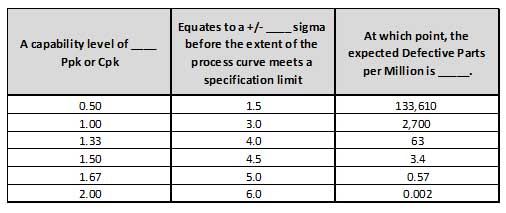
If, for instance, your process yields a Cpk of 1.33, then you can approximate that 63 parts per million produced from that process will be defective. Those more statistically inclined could confirm these results by looking up the sigma level (3 times the Cpk) on a Standard Normal Z Table or by converting it in Excel using the NORM.S.DIST equation.
But every so often, a student will email me to ask why this table or their Excel calculations don’t match the conversion table they found online or in their six-sigma textbook. And they’ll attach a table that looks something like this:
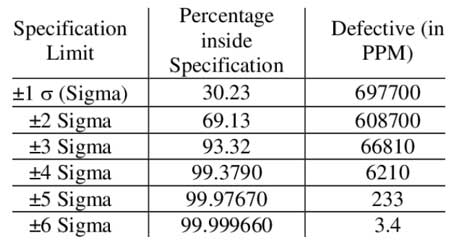
A cursory comparison of the two tables is all it takes to see that these are definitely not the same. For instance, +/- 6 sigma on the first table equates to 2 parts per billion, but on the second table, 3.4 parts per million. That’s a 1700-fold increase. Clearly something is wrong.
The difference between these tables is simple. The first is derived using the standard formulas approaches found in any statistics textbook. The second is similarly derived, but then distorted by something called the “1.5 sigma shift”.
The 1.5 sigma shift is a rule common in the six-sigma world that states, over time a process will appear to degrade by 1.5 sigma because of long-term variables that were never encountered during a process capability study.
So, to apply the 1.5 sigma shift rule, you simply find the sigma level of your process (again, 3 times your Cpk), and then subtract 1.5 sigma to find your “true” process capability and resulting defect level.
You can see this connection even in our simple tables above by noting that both +/- 4.5 sigma in the first table and +/- 6 sigma is the second table both result in 3.4 defective parts per million.
For a deep-dive into Process Capability Analysis, sign up for my online class of the same name. I keep the selling price of the class low to allow as many quality and reliability professionals as possible to advance their skillsets and ultimately their careers. Click here to sign up: