Aside from meeting specific requirements within quality standards such as ISO 9001 and ISO 13485, well-designed quality system metrics can also serve as meaningful indicators of the strengths and weaknesses of your organization’s processes. As a quality manager, I often consider how precisely our quality system objectives and other metrics describe the effectiveness of our quality processes. Certain metrics such as customer-reported DPPM and customer survey results usually serve to indicate your customers’ satisfaction related to quality. As metrics such as these are tracked over time, managers get a general sense of improvement or decline. Composite measures such as these, however, do not discriminate between quality assurance (preventive) and quality control activities.
Recently, I was considering the effectiveness of my company’s quality system in shielding our customers from our production processes’ failings. In other words, we know that our manufacturing processes aren’t perfect, and that they do create defects. Therefore, we have several quality control systems in place designed to cull these defects from the material we ship to our customers. These systems include various automated inspections, manual sorting, rework, auditing, etc. And so the question is: How effective is the sum of these quality control efforts?
Most organizations measure their internal rejects by part number, process, or some other logical grouping. Similarly, organizations also typically measure their customer-reported defects by percent defective or DPPM. By combining these metrics, an organization can determine the effectiveness of their quality control processes.
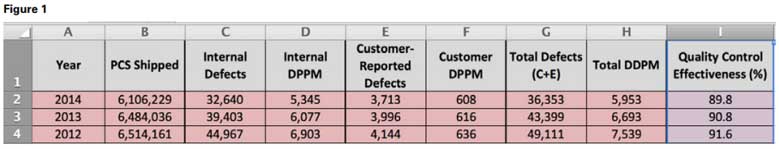
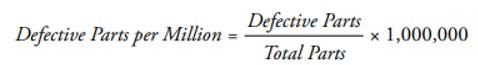
Consider the data table of internally and externally reported defects and their associated DPPM values by year shown in Figure 1. Columns C, E, and G show the actual number of reported defects internally, externally, and in total, respectively. Columns D, F, and H use the values from column B (PCS Shipped) and the reported defects to calculate Internal, Customer, and Total DPPM, respectively. See the formula for DPPM below:
In this case, we see year-over-year improvement in both Internal and Customer-Reported Defects and DPPM. This suggests that certain factors such as continual improvement activities and product mix are leading to fewer total defects in the product stream. This is welcomed news for any organization, but the typical product quality metrics stop at this point.
The Quality Control Effectiveness (QCE) metric shown in the far-right column of Figure 1 assumes that the total number of defects in the population is the sum of the internally reported and customer-reported reported defects. The formula for this metric is then:
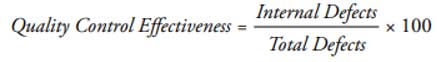
Using this formula, we can see that in 2014 this organization prevented 89.8 percent of the total defects produced from getting to their customers. We can also see that although the total defects and DPPM trended favorably year over year, the QCE did not. A lower QCE indicates that a lower percentage of the total defects were captured prior to shipment.
QCE is essentially a measure of the effectiveness of your defect detection processes. An upward trending QCE could indicate improving defect detection systems, while a downward trending QCE could indicate degrading defect detection systems or a product mix that contains defects that are difficult to detect. If I were consulting for a company with these quality metrics, I would suggest that they examine their quality control systems. It may be that their inspection methods are not keeping pace with their customers’ increasing quality expectations.
Two notes of caution while applying this metric: First, QCE does not account for the severity of the defects produced. Therefore, an organization’s QCE may be trending upward while their customer’s satisfaction is trending downward if their processes are allowing fewer but more severe defects to escape. Secondly, QCE may be a biased estimator since customer defect data tends to be under-reported, and supplier defect data tends to be over-reported relative to the true number of defects in the population.
While this example uses the QCE metric to compare one year to the next, a quality professional can also use it to make comparisons of part families, manufacturing facilities, or any other logical grouping. Developing metrics that distinguish between defect prevention and defect detection may unlock your organization’s next level of quality improvement.
To ratchet up your manufacturing skill set at an affordable price, check out the variety of quality, manufacturing and business-finance related online courses Ray Harkins teaches on Udemy.com:
Root Cause Analysis and the 8D Corrective Action Process
Return on Investment Analysis for Manufacturing