
If you’ve worked around the fields of reliability or quality for any length of time, you’ve certainly encountered and have likely assembled the humble yet mighty histogram. This specialized bar graph is one of the most common starting points for analyzing continuous data. It not only portrays the frequency of numerical data across its range of values, but also provides hints at the data’s underlying probability distribution.
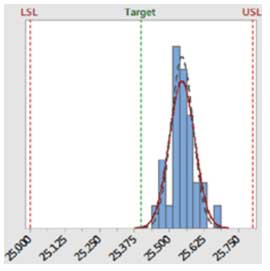
While histograms like the one shown above can be automatically generated by statistical programs like Minitab, it’s not uncommon for analysts to build them “from scratch” using spreadsheet programs.
One of the preferential aspects of building a histogram is selecting the appropriate number of bins, as there is no right or wrong answer to this issue. But too few bins “over smooths” the data, potentially masking those hints at the underlying distribution. And too many bins make the data look choppy and discontinuous.
In the early 20th century, German statistician Herbert Sturges formulated a method (now called Sturges’ Rule) of choosing the optimum number of bins in a histogram that minimize the potential for these pitfalls. His formula is simple:
k = 1 + 3.322 log n
Where:
k = the number of bins
n = the number of observations in the data set.
Applying Sturge’s rule to some common sample sizes, we obtain the following number of bins:
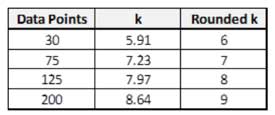
Most data visualization practitioners agree that Sturge’s Rule provides the most attractive outcome where the data 1) is not heavily shewed, and 2) contain between 30 and 200 observations. Applying Sturges’ Rule to datasets with greater than 200 points may again lead to over-smoothing, but it still remains a good starting point.
Less popular, but not necessarily less effective means of selecting the best number of bins for your histogram include the Square-Root Choice, Rice’s Rule, Doane’s formula, Scott’s Normal Reference Rule, and Freedman–Diaconis’ Choice.
Once you’ve selected the number of bins, calculate the minimum bin width to using the following formula:
Min Bin Width = (Max Observed Value – Min Observed Value) / k
It’s common practice then to round the Min Bin Width up to a convenient decimal to make the increments along the x-axis a little more readable.
To learn more about quality engineering statistics, including histograms, control charts and the normal probability distribution, sign up the online short course titled “Process Capability Analysis”. Or for a more extensive look at using statistical analysis in manufacturing quality, try Statistical Process Control (SPC) using Microsoft Excel.