If you’ve ever participated on a project team considering the purchase of a major piece of equipment, you’ve almost certainly heard of “Payback Period” – the length of time projected to recoup an initial investment through cost savings, increase profits, etc. It’s fairly simple to calculate:
Payback Period = Initial investment / Annual Cash Flow
For instance, if you spend $100,000 on an automated inspection device that eliminates $20,000 per year in manual inspection labor,
Payback Period = $100,000 / $20,000 = 5 years
In an actual scenario, a payback period model can become a bit complicated with the addition of on-going costs like periodic maintenance, changes in work-in-process inventory, utility costs, etc. But once all the inputs are organized into a model, the payback period calculation itself is straightforward.
Many business managers follow the rule of thumb that shorter payback periods are better than long ones. Therefore, when deciding between multiple projects competing for the same budget dollars, the short payback period projects usually win out. Some organizations also have payback period thresholds – 2 years max, for instance – that capital projects must meet to be considered for investment.
Because of its relative simplicity, this method is very popular and serves as an excellent starting point for project managers and executives considering a major investment. But as a primary return on investment analysis tool, it falls short of providing an accurate or complete financial picture of the effects of a project on an organization.
One problem with the payback period method is that it doesn’t account for the time value of money. In nearly every situation, today’s money is worth more than tomorrow’s money. One reason for this is inflation – the sustained increase in general price levels in an economy. According to the U.S. Inflation Calculator for instance, the inflation rate was 2.3% per year for the 12 months ending in February 2020. This means that $1,000 today will only buys $977 worth of goods in a year.
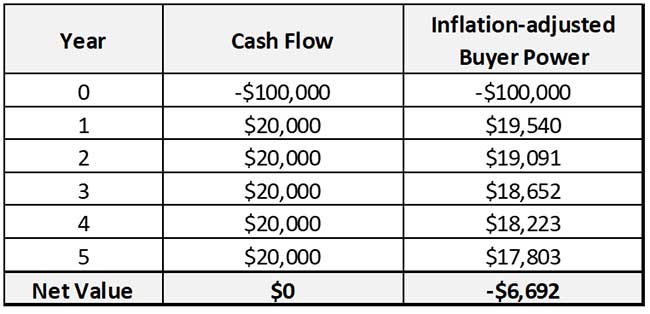
Using the example of the automated inspection device and assuming a steady rate of inflation, each annual return of $20,000 has 2.3% less buying power than it did the previous year. Using an annual compounding rate:

So, while all the dollars (or Yen, Shekels, or Dongs) were eventually returned to the organization’s coffers via the labor cost savings, they were worth less by the time they got there.
A second reason tomorrow’s money is worth less than today’s is the organization’s “cost of capital”. The money used to make these investments is either borrowed from lending institutions or belongs to the shareholders. Borrowed money comes at the cost of interest. The money belonging to the shareholders comes at the cost of an expected return on equity, some of which is paid out to the shareholders in the form of dividends.
Therefore, whether the initial investment was borrowed from a bank or came from the organization’s retained earnings, some portion of the project’s profits (cost savings, increase profits, etc.) are needed to cover the cost of the capital.
The degrading effects of inflation and the organization’s cost of capital both lead to the classic “payback period” to under estimate the true payback period of a capital investment.
In the next article, we’ll examine a second problem with the payback period method and starting looking for a different means of estimating the true value of a capital project.
Read “The Problems with Payback Period, Part 2“.
For a deeper dive into capital equipment justification, and to learn the essentials of business finance all managers need, sign up today for Return on Investment (ROI) Modeling and Analysis or Business Finance: A Complete Introduction.


