One excellent starting point of the investigation phase of a root cause analysis is the comparison of the product measurements to the available process data. With an effective traceability system, you can define a relatively short time range in which the defective parts were manufactured. Once these “fence posts” are identified, use them to examine the available process data such as the recorded pressures, temperatures, times, and speeds.
One of the cornerstone principles of statistical process control is that stable processes produce stable products. So, where you find evidence of a defective product, you can be assured that at some point, the process went amiss. Unfortunately, while this principle is dependable across nearly every application, not every process has data collection system in place to gather the right inputs at the right frequency to make this principle useful.
But where the process data is available, an astute investigator can often uncover correlations and commonalities between the product and process data that leads to the true root cause of the defect.
The three most common approaches to comparing product and process data are 1) a visual comparison of product and process run charts, 2) developing a scatterplot of a pair of product and process variables, and 3) the use of statistical tools such as Pearson’s Correlation Coefficient and regression analysis.
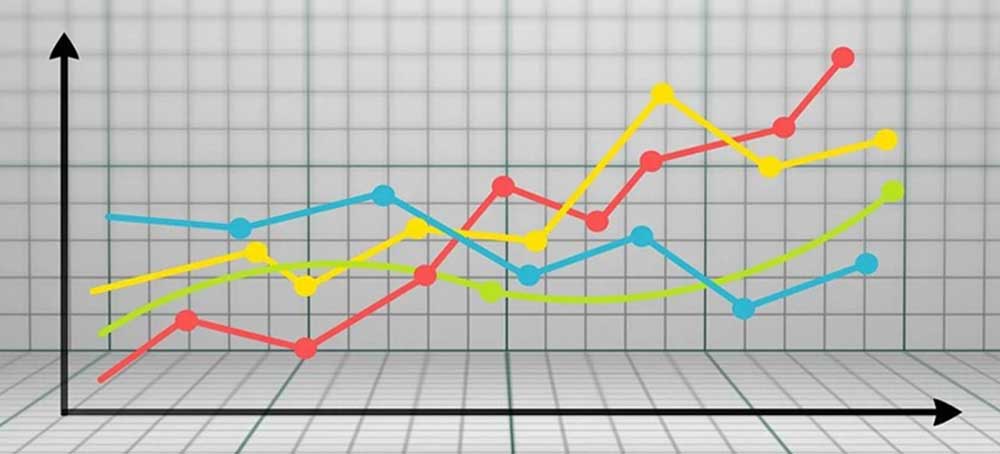
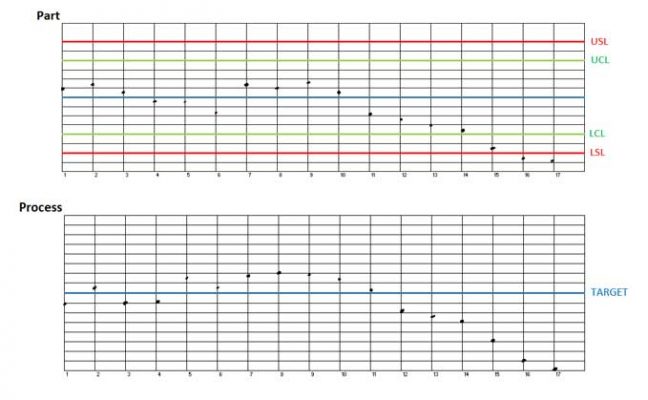
The first approach is as simple as it sounds. Start with the run chart of a product variable showing a block of time before and after the feature in question trended out of control. Align the process data run charts with the product run chart so the time frame is identical. By finding which process characteristics move in synchrony with the product characteristic, you will better understand the quality drivers of your process.
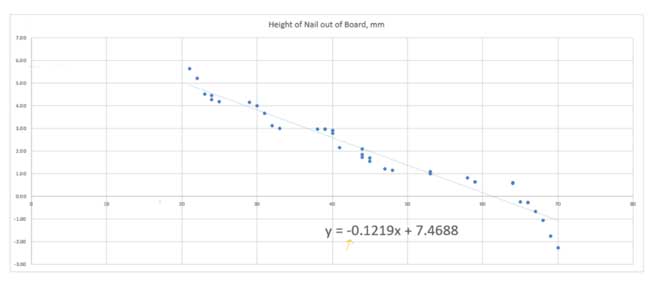
Developing a scatterplot provides a more definitive view of the relationship between product and process variables. Typically, the product variable (length, surface roughness, etc.) is plotted on the x-axis while the process variable (temperature, feed rate, etc.) is plotted on the y-axis. The resulting scatterplot will graphically depict the relationship between the variables, and help define that relationship into rough categories of correlation such as weak or strong, and positive or negative.
The third approach of using statistical tools to quantify the relationship between product and process variables runs very deep. The two tools mentioned – correlation and regression – are excellent entry points into this field of descriptive statistics. Pearson’s Correlation Coefficient is a statistical tool used to measure the linear dependence between two variables. Where a scatterplot will aid your qualitatively description of this relationship with terms like “strong positive” or “weak negative”, this correlation coefficient will help you quantitatively describe it with a range of values between -1.0 and +1.0.
Linear regression analysis adds a further dimension to the quantitative description of this relationship by defining in algebraic terms the best fitting line through the points in your scatter plot.
A deeper dive into correlating product and process variables, plus dozens of tips and tools like this are available in the online classes “Root Cause Analysis and the 8D Corrective Action Process” and “Mastering the Seven Quality Tools”.