

This is one of the more common questions I received from students taking my “Process Capability Analysis” course. And it’s a great question since it unveils an apparent paradox. But trust me, the answer is simpler than it first appears.
If you’re familiar with capability analysis, you known that Pp and Ppk are measures of “between subgroup” variation, while Cp and Cpk are measures of “within subgroup variation”. Specifically, the formulas for Pp and Ppk consider all the points in a dataset when estimating its standard deviation, effectively ignoring any subgroups or order among the data points. The formulas for Cp and Cpk on the other hand form estimates of standard deviation by averaging the range of each subgroup.
So how can you calculate Cp or Cpk with a subgroup of 1 where the within subgroup variation is 0?
Let’s consider the formula for Cpk:
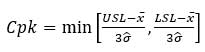
where σ ̂, or “sigma hat” as it’s called, is an estimation of the sample standard deviation found using this formula:
![]()
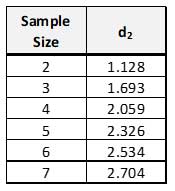
where the numerator, R, is the average range of the subgroups and d2 is a constant found on the Table of Control Chart Constants.
By examining the following dataset, you will notice that the range of each of the eight subgroups is equal to the difference between its max and min values, and the R is equal to the average of the eight ranges.
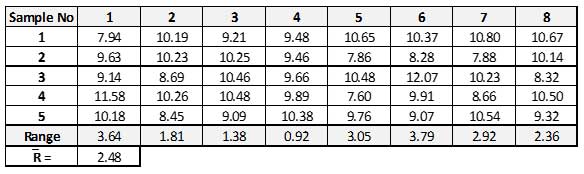
![]() is then found by dividing by the d2 designated for that subgroup size. With a subgroup size of 5, the d2 equals 2.326 as noted on the table below.
is then found by dividing by the d2 designated for that subgroup size. With a subgroup size of 5, the d2 equals 2.326 as noted on the table below.
Therefore our ![]() in this example equals (2.48 / 2.326) = 1.067.
in this example equals (2.48 / 2.326) = 1.067.
Now, back to our original question: how can we calculate Cpk with a subgroup of 1?
Subgroups of 1 are found on Individual and Moving Range (IX&MR) charts, among other places. IX&MR charts are commonly used when capturing a subgroup of multiple samples is too difficult, too expensive, or spread out over a long time span. In these cases, you simply capture a single data point to plot.
Then, instead of calculating R as the difference between the max and min values of a subgroup, you calculate it as the difference between one point and the next point, thus the “moving range”. Let’s look at an example:
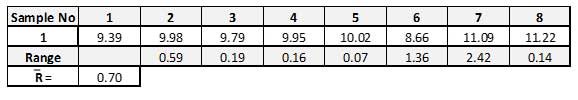
The Range for Point 2 for instance, is the absolute value of the difference between Points 2 and 1; the Range for Point 3 is the absolute value of the difference between Points 3 and 2.; and so on. R is still the average of our range values. And now, the subgroup is 2.
Referring to our table of d2 constants above, we find that ![]() is now equal to (.70 / 1.128) = .621.
is now equal to (.70 / 1.128) = .621.
When working with the moving range approach of calculating on an IX&MR chart, you may also elect to use larger subgroups or 3 or more.
To learn more about subgroups, sample sizes and quality control statistics, sign up for the low-cost, high-quality online courses titled “Process Capability Analysis” and “Statistical Process Control (SPC) using Microsoft Excel”.
Nicely explained – awesome … awesome … o’ya I almost forgot to say awesome!