I remember the feeling I had as child when I first heard about Rudolf. I was certain that Santa had eight reindeer. Then suddenly one day, I was wrong. Somehow a ninth reindeer had appeared on the scene and forever altered my view of St. Nick’s tiny sleigh. This feeling of cognitive dissonance recurred years later when I first heard about Cpm – the “Rudolf” of capability indices. I knew about Cp and Cpk. I knew about Pp and Ppk. And I thought that was it. But once again, the mental rug was yanked from beneath me when abruptly I realized there was more.
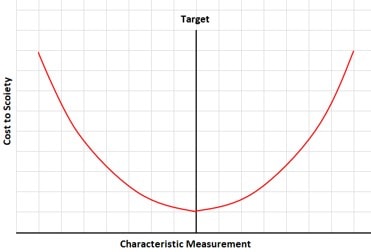
The origins of this capability index go back to the middle 1960’s and a statistician named Genichi Taguchi. During his professorship at Aoyama Gakuin University in Japan, he developed a concept called the Quality Loss Function, which in a nutshell states that the further a characteristic deviates from its target, the greater the loss to society.

To explore this concept a bit, consider a bottling line that fills 1-gallon milk jugs. The target filling volume for these jugs is 128 ounces, and at this exact volume, Taguchi would assert that the loss to society is at its lowest point. If the bottling line adds 129 ounces to the jug, the producer loses the value of that 1 extra ounce of milk since the consumer pays the same price for the entire jug. The loss to the producer doubles if the bottling line adds 130 ounces to the jug. If the bottling line attempts to add 131 ounces to the jug, not only does the producer not get paid for the extra 3 ounces, but the extra milk spills onto the outside of the jug and it needs washed before it can ship. At 140 ounces, not only does the producer not get paid for the extra milk, but now the milk spills onto the floor, and the line is stopped to clean up the milk. As the deviation from the target increases so does the loss.
This same loss to society occurs when the milk jug is under filled. If a jug contains 127 ounces, a consumer would pay the full price for the jug but not receive that 1 ounce of milk. The loss to the consumer increases at 126 and 125 ounces. At less than 124 ounces, many consumers would notice that the jug is not filled and would skip over it in lieu of a fuller jug. If that happens enough, the milk expires and the store owner loses the cost of the entire jug. Again, as the deviation from the target increases so does the loss to someone.
To express the capability of a process with this loss function in mind, Taguchi needed a new index that accounted for both the process variation and the centeredness of the process about the target. Now if you’re already familiar with Cpk and Ppk, or if you read the previous article in this series titled, “What’s the difference between Cpk and Ppk?”, you may be thinking, “Wait a #%$^*& minute!! I thought Cpk and Ppk accounted for centeredness??!!” But you’re only partially correct.
Let’s consider the formula for Cpk:
![]()
Cpk expresses the ratio of 1) the distance from the process mean to the nearest specification limit to 2) half the expected process range. By default, most quality practitioners deduce that if a process mean is far enough away from either specification limit, then the process is centered. And the emphasis when utilizing the traditional capability indices then becomes predicting the ratio of parts that will be out of specification. But all this focus on how close our product is to falling off the specification cliff is contradictory to Taguchi’s Loss Function concept.
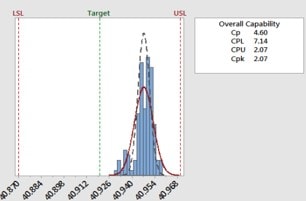
Here are the results of a capability study where the Cpk was rather high at 2.07 indicating that less than 2 parts per billion will fall outside the specification limits.

Most quality engineers would be elated with these results and move onto their next processing challenge. But is this process centered about the target? Certainly not. With a sole focus on specification limits, it’s quite possible to sign off on a process that very consistently delivers a loss to your customers, your organization, or both.
Highlighting this loss is where Cpm shines. Let’s look at the formula:

Immediately you’ll notice that Cpm looks strangely familiar to its older siblings Cp and Pp:

The difference between these indices is simply in the measure of dispersion used in the denominators of each: sigma-hat, sigma (aka ‘s’) or sigma-Cpm for Cp, Pp and Cpm, respectively. And if you’re familiar with statistics, you’ll also notice that is closely related to sample standard deviation, sigma:

Sigma is a measure of variation1 around the process mean x-bar, whereas sigma-Cpm is a measure of variation around the independent target, T. Unlike the traditional capability indices, Cpm has no concern with the process mean or its distance from the specification limits. Its only concern is the variation of the individual data points relative to the target. So where Cp and Pp are ratios of the specification range to the variation about the process mean, Cpm is a ratio specification range to the variation about the target.
Using some algebraic wizardry, we can derive an equation that expresses Cpm in terms of Cp, a useful formula when conducting capability studies:

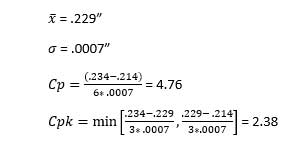
Let’s consider a simple case study involving a flat stock rolling mill to highlight the differences between these indices. Steel flat stock is produced by heating large billets of steel and then feeding them through a series of rollers until a standardized thickness range is achieved. One particular gage and grade of flat stock has a thickness specification of .224 +/- .010”. After drawing your samples and collecting your measurements, your capability study yields the following results:

2.38 is an excellent Cpk indicating that an infinitesimal percentage of material will ever be out of specification. In most scenarios, this process would be approved for production. But imagine for a particular application, you know that the ideal thickness target for the flat stock is .220”. Using this rolling process, you will very consistently waste .009” of steel (across perhaps thousands of feet of material) every time you run that order. By applying our Cpm equation to this same process, we find:

A capability index of 1.14 paints a much bleaker picture of this process.
Since Cpm doesn’t use specification limits, it can’t be used to estimate percent defective like its siblings. But again, that’s not its purpose. With Cpm’s focus on the application’s target, it works very well in comparing processes where the target is not the center of the specification range. If we could respond to the dismal Cpm in our example for instance, by shifting the process mean down to .225” when we run this customer’s product, the Cpm becomes:

The higher Cpm of course translates into far less loss to our organization, a discovery that would not have been made with Cpk alone.
And just like Santa’s eight … pardon me, nine reindeer, this team of capability indices is designed to work together. Instead of pulling a sleigh of course, they’re describing the relationship of a process to its specifications in a way no single index can.
Footnote:
- This article uses the conventions sigma and sigma-hat to represent an estimation of the standard deviation and the sample standard deviation, respectively. Other texts use sigma to represent the population standard deviation, and s to represent the sample standard deviation. Regardless of the convention used, the method is effective is measuring process capability.


