Customers from a range of industries like heavy truck, automotive, and oil and gas commonly require the forgings they purchase to be heat-treated using processes such as normalizing, annealing, or quench and tempering. Each of these processes, when applied to a given material chemistry, is designed to generate a unique set of mechanical properties within the forging’s base material. With the appropriate process design, heat treatment can harden, soften, strengthen, stress-relieve, or improve the ductility of a forged component in magnitudes unachievable otherwise.
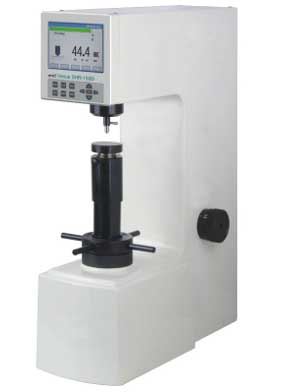
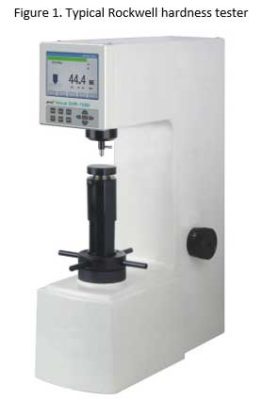
As a result, forging suppliers often wrestle with the testing methods required to verify that the selected heat treatment process attained their customers’ desired results. And the most common of these verification methods, employed by forgers of steel, aluminum, and titanium, is Rockwell Hardness testing. (See Figure 1.)
The general principle of Rockwell testing, as defined by ASTM E181, is relatively simple:
- A hardened indenter made to a specific geometry is brought into contact with the test piece.
- A specific load is applied to the indenter for a given duration, forcing it into the test surface.
- The resulting penetration depth of the indenter into the surface of the test piece equates to a Rockwell hardness value.
Given the range of indenter shapes, sizes, and test loads, ASTM E18 defines 15 different Rockwell scales intended for use on a variety of materials and section thicknesses. In practice however, the two most common Rockwell scales are B and C, where the B scale uses 1/16-inch tungsten steel ball and a 100 kg test load, and the C scale uses a spheroconical diamond indenter and a 150 kg test load.
The B scale is used for measuring softer materials like aluminum alloys, which measure about 60 Hrb (Hardness, Rockwell B). And the C scale is used to measure harder materials like quench-and-tempered alloy steel, which measures about 30 Hrc (Hardness, Rockwell C), or air-quenched tools steel which can measure well over 60 hrc.
Unfortunately, given the ubiquitous use of the Rockwell Hardness test and its apparent simplicity, forging companies, inspection labs and material processors have inadvertently introduced a wide range of sample preparation and testing practices that have resulted in poor tester-to-tester correlation. And the variation in these practices required to produce a significant shift in the hardness reading is surprisingly small. A mere .002 millimeters (2 microns) difference in indention depth – the approximate diameter of a coccus bacteria–results in a full point shift on both the Rockwell B and C scales.
Poor correlation between suppliers’ and customers’ hardness results becomes problematic when parts near a hardness specification limit generate downstream processing issues. Engineers trying to resolve tool breakage or premature tool wear problems often look to the hardness of the forging early in their investigation.
Thankfully, a handful of easy-to-implement best practices can minimize this measurement variation and the wasted energy that accompanies erroneous inspection results.
One means of minimizing hardness measurement error is found inside the test apparatus. Traditionally, Rockwell hardness testers generate the required indention load through a series of dead weights and levering mechanisms. The designs of these older-style testers are simple, inexpensive to manufacture, and generate a level of accuracy that was acceptable to industry for many decades.
However, corrosion, dust, debris, and mechanical wear in the lever-arm pivot points cause discrepancies between the loads prescribed in ASTM E-18 and actual loads applied to the sample. And these discrepancies are difficult to detect in these older systems. But modern Rockwell hardness testers like the Phase II Model 900-415 and the Starrett Model 3832 have solved the problem of friction-producing mechanical elements by replacing them with closed-loop, motor-controlled loading systems.
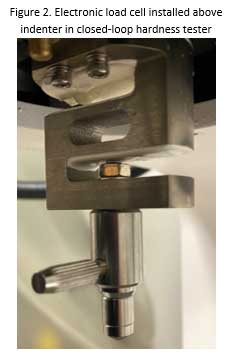
Newer testers apply the prescribed load via a DC electric motor, and then measure that load with an electronic load cell. The load cell then “closes the loop” by communicating the actual load reading back to the DC motor so it can make the required minute adjustments prior to the start of the test. (See Figure 2.)
Research has shown that typical dead-weight testers achieve gage R&R results from 12% to 25%, while closed-loop testers “can routinely achieve less than 7 percent.” 2
A second set of best practices for hardness testing pertain to the adequate preparation of the test samples. The outermost surfaces of forged and heat-treated steel components – typically .1 to .3 mm deep – are comprised of a very hard and brittle iron oxide layer called “mill scale”, and/or “decarburization”, a condition resulting in a significant softening of the material when exposed to gases such as hydrogen and oxygen at elevated temperatures. Neither of these resulting material conditions has the same hardness as the great majority of the test sample lying immediately beneath them. Therefore, to obtain an accurate hardness reading, it is critical to remove them before testing.
ASTM E-18 provides the following guidance in section 6.1,
“For best results, both the test surface and the bottom surface of the test piece should be smooth, even and free from oxide scale, foreign matter, and lubricants.”3
In practice, technicians will prepare the sample by first belt sanding the bottom surface of the test piece to remove all loose mill scale and create a stable surface. They then bench-grind a section of the test surface to a depth of .5mm to 1.0 mm deep to remove the mill scale and the surface material affected by decarburization. (See Figures 3 and 4.) This step is taken with care as not to “burn,” gouge or alter the properties of the base material. Without these two key preparation steps, technicians will unknowingly introduce errors into the test results.
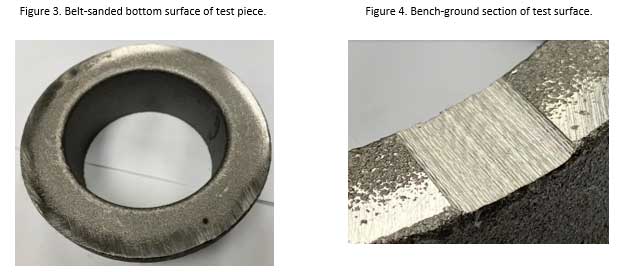
Forging companies that also perform downstream machining operations such as CNC turning often skip these preparation steps, thinking that since the scale and decarburization has already been removed, no further preparation is required. However, machining introduces feed lines onto the sample which will bias hardness test results.
A third practice effective in reducing hardness test error is found in conducting repeated tests of the same sample, then averaging the results. Recalling that a 2-micron difference in indention depth results in a full point shift on the output reading, it is not difficult to imagine how very minor discrepancies within the testing unit or on the sample can result in a significant shift. Repeating the hardness tests on the same surface tends to “smooth out” these discrepancies, resulting in a final, averaged value closer to the true hardness of the sample.
After preparing a set of samples, experienced technicians typically test the prepared surface of each three time, recording the full resolution of the measurement scale. The average of the three tests is the recorded hardness value for that sample. Rounding or truncating the individual test results also introduces avoidable test error.
One final practice for reducing hardness test error is estimating and adjusting for gage bias. Bias is the result of a systemic error within the measurement system that tends to shift output values in the same direction and magnitude. For instance, a pair of calipers that is not “zeroed out” will demonstrate bias since it will repeatedly report a measured value in the same direction and magnitude from the true part measurement.
Bias in a Rockwell hardness tester is estimated with the use of a certified hardness test block. These test blocks are meticulously manufactured from high-grade materials, then tested and calibrated to assure superior levels of accuracy. (See Figure 5.)
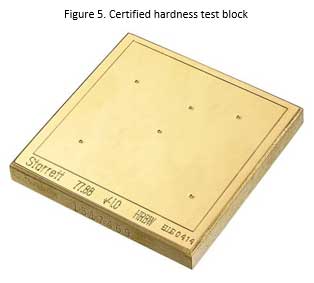
To estimate gage bias, technicians will test a certified hardness block three times before and three times after a long series of part tests. Like the hardness results from the part tests, these individual values are also averaged to generate a tester-reported value for the certified block. This before-and-after measurement of the test block helps account for any drift that may have occurred during the series of sample tests. The difference between these averaged values and the value etched into the test block is the estimate of gage bias.
For example, if a certified hardness test block calibrated to a value of 86.22 Hrb is tested three times consecutively before the start of the part tests with values 87.15, 87.09 and 87.14, and three times after the part tests with values of 87.19, 87.12 and 87.13, the estimation of gage bias is:

For a shorter series of part tests, typically 5 of fewer samples, only a “before” estimate of bias is usually sufficient.
By utilizing a few “best practices” in hardness testing such as closed-loop load monitoring, the appropriate preparation for test samples, repeated sample measurements, and adjusting measured values for gage bias, measurement professionals can minimize testing error and the frustration that often accompanies erroneous hardness readings.
RH
References:
- ASTM International. ASTM E18-22, Standard Test Method for Rockwell Hardness of Metallic Materials. May 26, 2022.
- Tobolski, Edward. “Closed-Loop Control in Hardness Testing”. Quality Digest Magazine. August, 2004. https://www.qualitydigest.com/aug02/articles/04_article.shtml
- ASTM International. ASTM E18-22, Standard Test Method for Rockwell Hardness of Metallic Materials. Page 5, Section 6.1. May 26, 2022.
Author’s Biography:
Ray Harkins is the Quality and Technical Manager for Ohio Star Forge in Warren, Ohio. He earned his Master of Science from Rochester Institute of Technology and his Master of Business Administration from Youngstown State University. He also teaches manufacturing and business-related skills through the online learning platform, Udemy.
Click on the following coupon codes to receive substantial discounts on his courses, or reach out to him via LinkedIn at linkedin.com/in/ray-harkins or by email at the.mfg.acad@gmail.com.
Reliability Engineering Statistics: https://www.udemy.com/course/reliability-engineering-statistics/?referralCode=C8CF07ACDEDF252A7C51
An Introduction to Reliability Engineering
An Introduction to Quality Engineering

